
Flagship tools

The two tools that own month-end.

A branded board-pack builder and a report layout you control account by account — the features practices lean on hardest when they close the month.

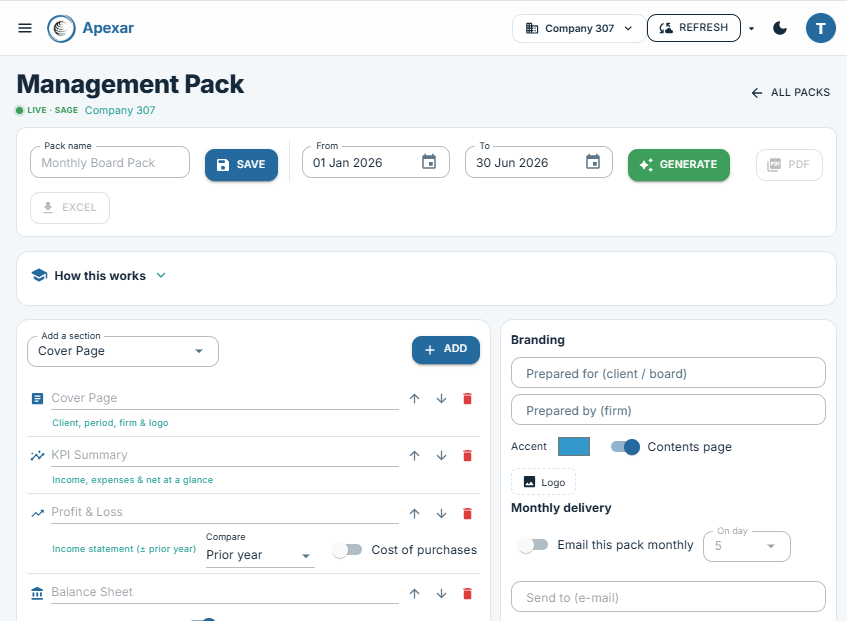
Apexar Management Pack builder — reorderable sections, branding and monthly delivery
Board & management reporting

Management Pack

Assemble a board pack section by section — cover page, KPI summary, P&L, balance sheet and more — reorder them, add your firm's logo and accent colour, then generate to PDF or Excel. Set it to email automatically each month, per client or per consolidated group.

  • Drag-and-order sections: cover, KPIs, P&L, balance sheet, cash flow and beyond
  • Your branding — "prepared for / prepared by", logo, accent colour, contents page
  • One click to a polished PDF or Excel pack
  • Schedule monthly delivery to any inbox, on a day you choose
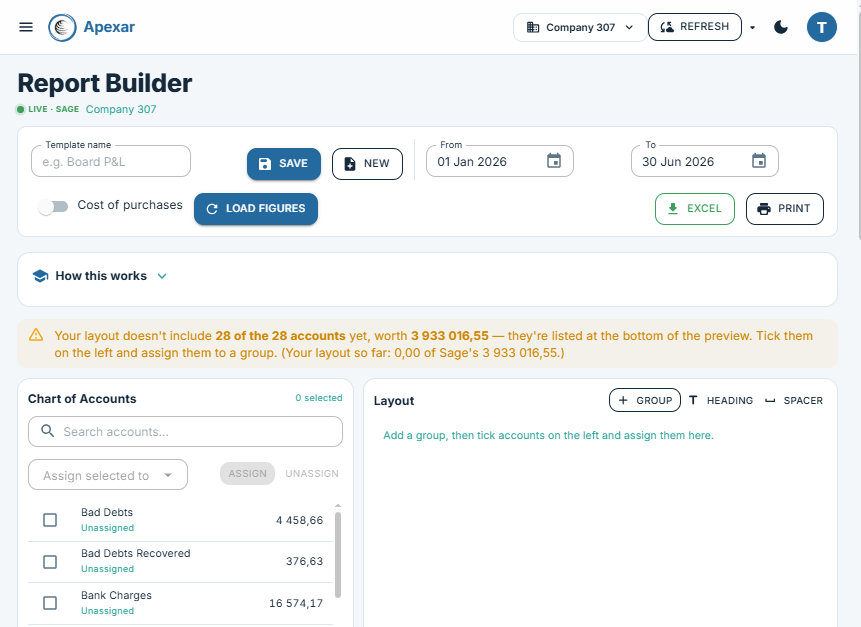
Apexar Report Builder — assign every Sage account into custom groups that reconcile to the cent
Custom financial statements

Report Builder

Compose a custom financial report straight from your Sage chart of accounts — create groups, headings and spacers, then assign every account exactly where you want it. Apexar flags any account you've left out, with its value, so the layout always reconciles back to Sage down to the cent.

  • Builds from the live Sage chart of accounts
  • Your structure — groups, headings and spacers
  • Nothing goes missing: unassigned accounts are flagged with their value
  • Reconciles to Sage to the cent — export to Excel or print
  • Save reusable templates for every client

Financial intelligence 14 reports

Live · via Sage API

The numbers, pulled on demand from Sage's own report engine at the moment they're run.

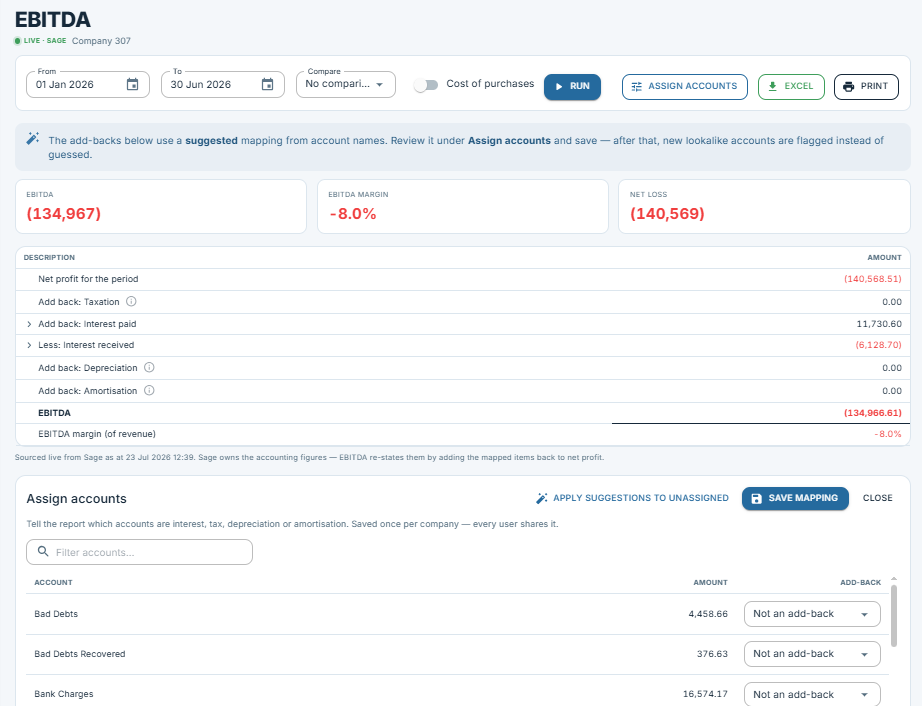
Apexar EBITDA — net profit re-stated with mapped add-backs, live from Sage
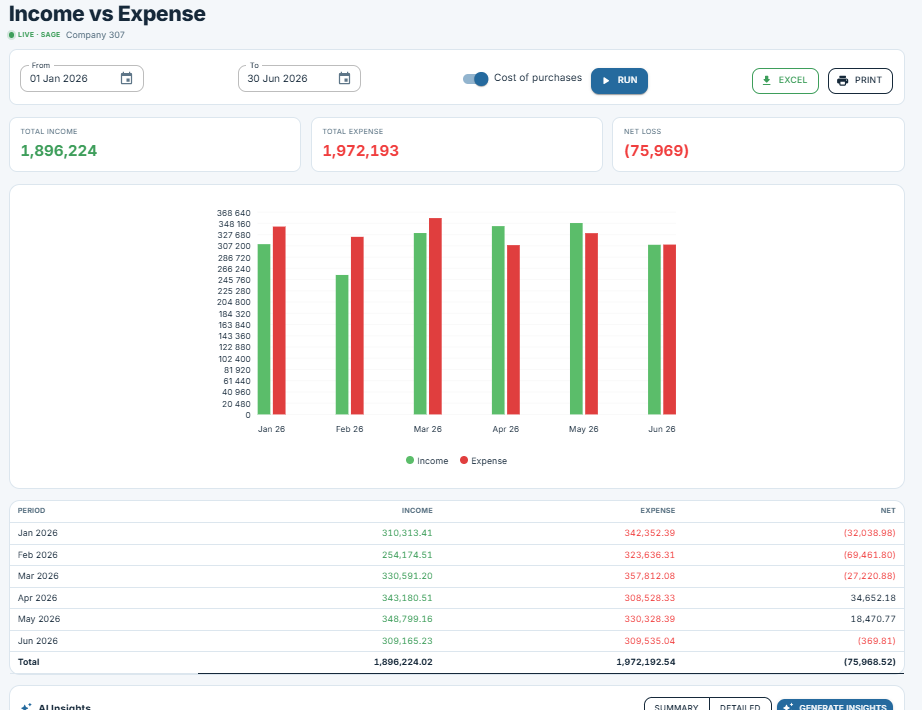
Apexar Income vs Expense — monthly income and expense with net result

Financials Hub

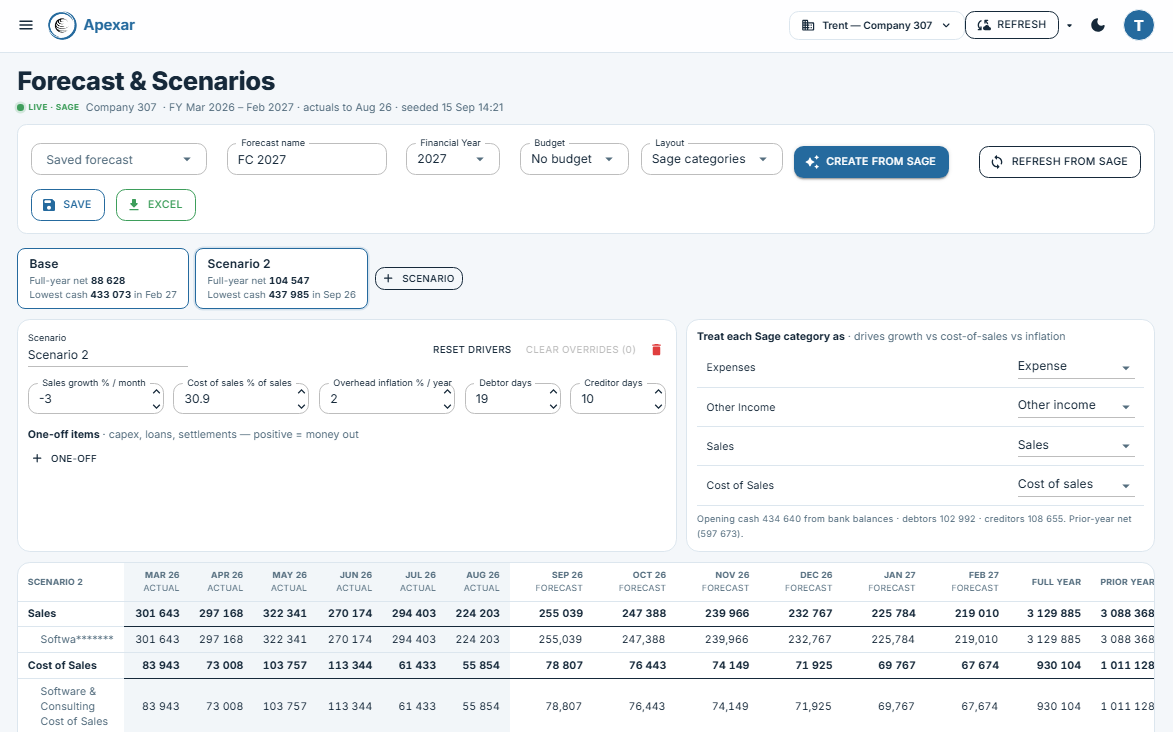
Your financial home at a glance — income, net result, cash on hand and outstanding debtors, with a 12-month trend and the biggest movers versus prior year.

Profit & Loss

The full income statement with multi-period comparatives, pulled live from Sage so it always matches the books.

EBITDA

Earnings before interest, tax, depreciation and amortisation — with drillable add-backs so every adjustment is traceable.

Balance Sheet

Assets, liabilities and equity at any date, with the key ratios that read the shape of the business.

Trial Balance

Every account's balance with built-in health checks that flag anomalies before they reach the statements.

Income vs Expense

Income and expense trended side by side to expose margin movement over time.

Cash Flow

Where cash came from and went — operating, investing and financing — across the period.

Aged Analysis

Debtors and creditors bucketed by age to surface collection and payment risk.

Cash Forecast

A 13-week rolling cash projection with what-if sliders to model timing changes.

Health Check

An automated reasonableness sweep across the ledger that flags what looks off.

VAT Check

Reasonableness checks on VAT to catch mis-postings before submission.

Cash & Bank

Live balances across every bank account, as at now.

Top Analytics

The biggest movers, largest balances and standout accounts, ranked.

Report Builder

Compose custom financial reports from the same live Sage data.

Operational visibility 10 reports + unlimited pivots

From SBCA data

The movement the reporting category never touched — sales, orders, items and demand. And with Pivot Analysis you build and save as many custom layouts as you like, so the ten reports below are only the starting point.

Apexar Sales Dashboard — revenue, orders, items and rep performance
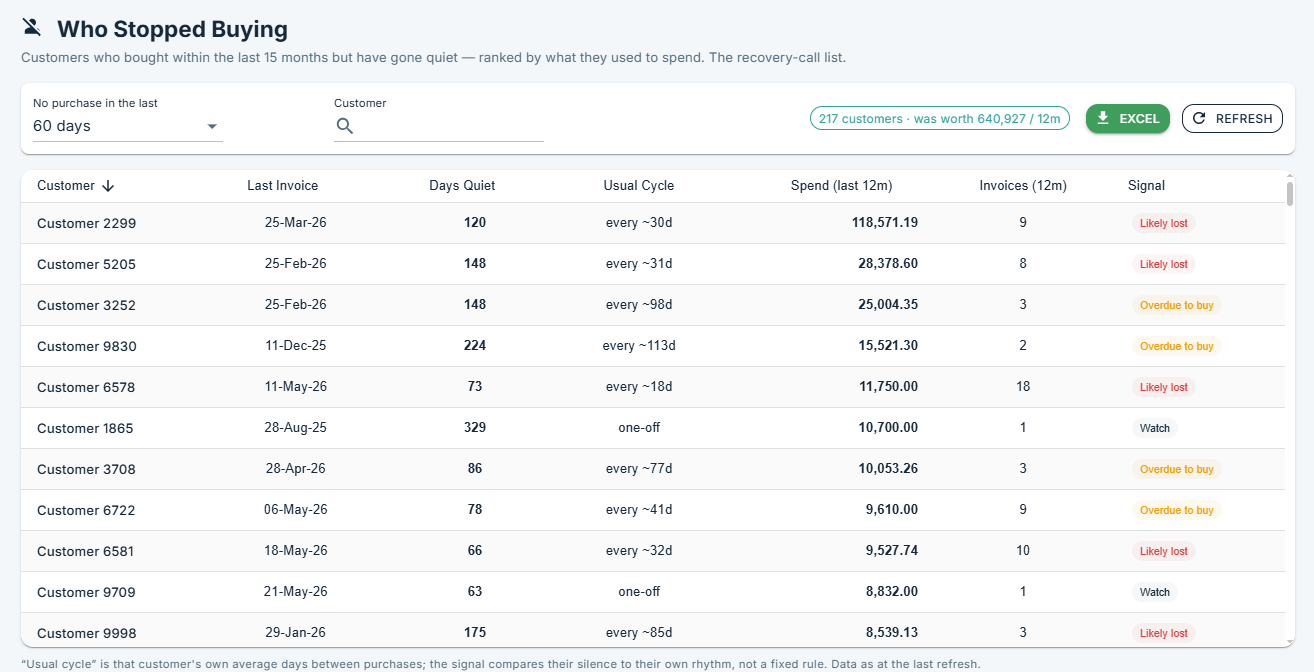
Apexar Who Stopped Buying — customer gaps ranked by spend

Sales Overview

Revenue, sales count, customers and average invoice, trended month by month with sales-rep contribution.

Sales Flash

A fast read on how sales are tracking right now against prior periods.

O/S Sales Orders

Outstanding sales orders line by line — ordered but part- or not-yet-fulfilled.

O/S Purchase Orders

Outstanding purchase orders line by line — on order but not yet received.

Item Demands

Item demand measured against stock on hand to expose shortfalls before they bite.

Item Forecast

Per-item statistical demand forecasting into suggested order quantities and weeks of cover.

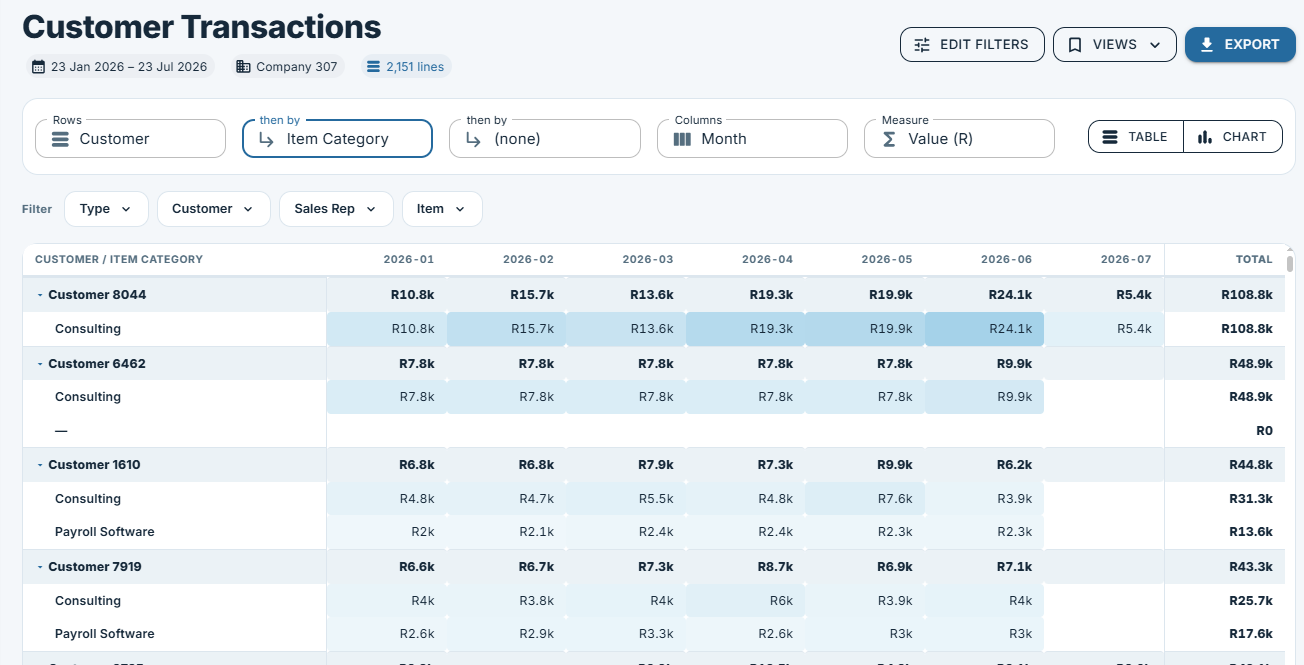
Customer Gaps

Detects customers who've slowed or stopped buying — churn before it shows in the numbers.

Sales Reps

Rep-by-rep performance and contribution across the book.

Analysis Categories

Slice sales across customer, item and category dimensions.

Pivot Analysis

Native pivot tables with drill-through — build and save as many custom layouts as you need. One report, effectively unlimited operational views.

Asset management 4 reports

Live · via Sage API

The register Sage asked us to build — because their own doesn't produce the schedules practices need.

Assets Overview

A summary of the asset base, its value and the actions coming up.

Asset Register

The full fixed-asset register — cost, category, acquisition and current book value.

Wear & Tear

SARS-aligned wear-and-tear depreciation schedules, calculated automatically.

Movements & Actions

An action diary for services, licences and warranties — with inferred disposals surfaced.

AI

AI narrates · never calculates

AI commentary that narrates figures the application has already computed — it never touches the arithmetic. Ask in plain English, then verify against the full report underneath.

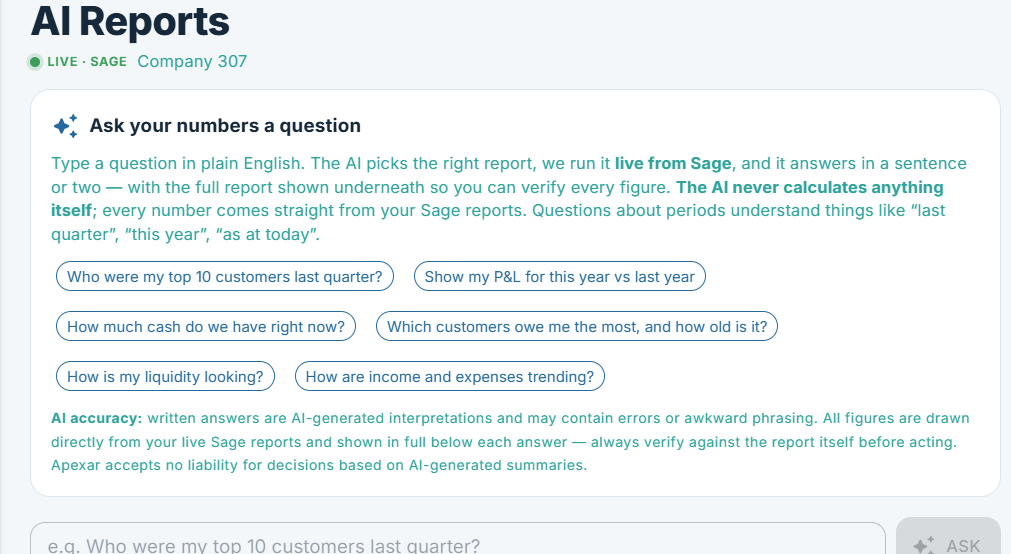
Apexar AI Reports — ask your numbers a question in plain English, answered live from Sage
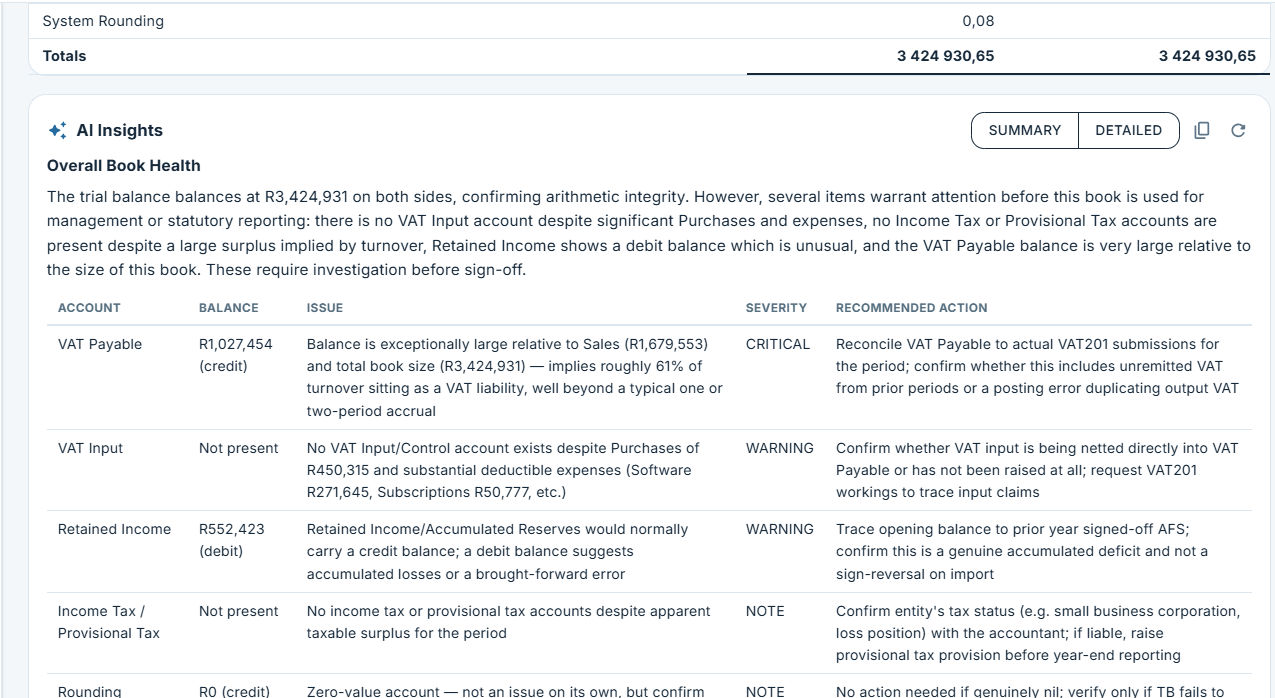
Apexar AI Insights — severity-flagged commentary with summary and detailed modes

AI Reports

Ask your numbers a question in plain English. Apexar picks the right report, runs it live from Sage, and answers in a sentence or two — the full report shown underneath so you can verify every figure. Every report also carries AI Insights: severity-flagged commentary (WARNING / NOTE), summary or detailed. Every number comes straight from Sage; the AI never calculates.

Ready to see your numbers clearly?